Viridis Demo
The code below demonstrates two color palettes in the viridis package. Each plot displays a contour map of the Maunga Whau volcano in Auckland, New Zealand.
Viridis colors
image(volcano, col = viridis(200))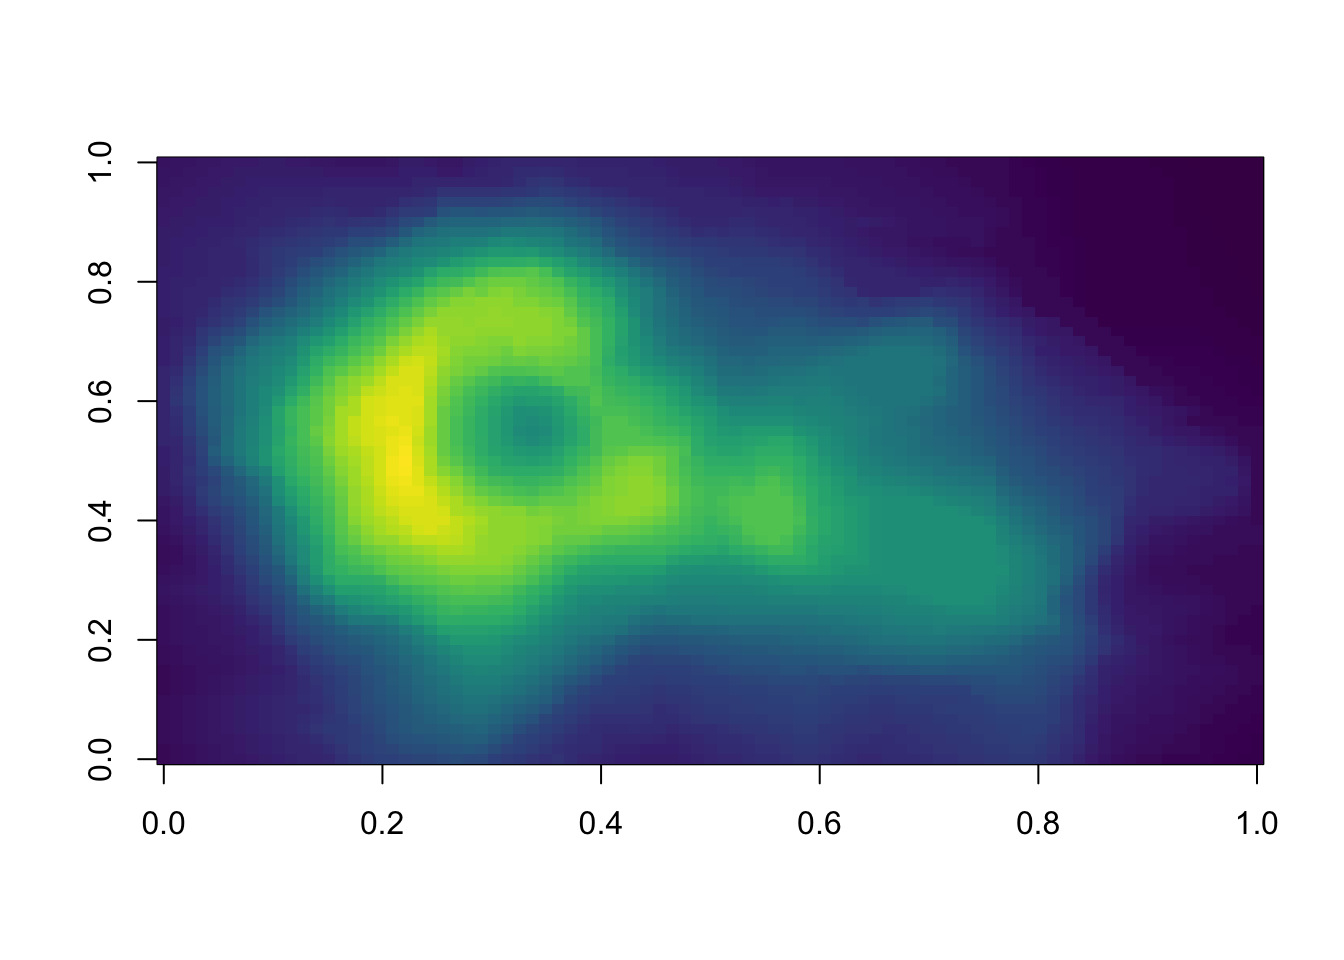
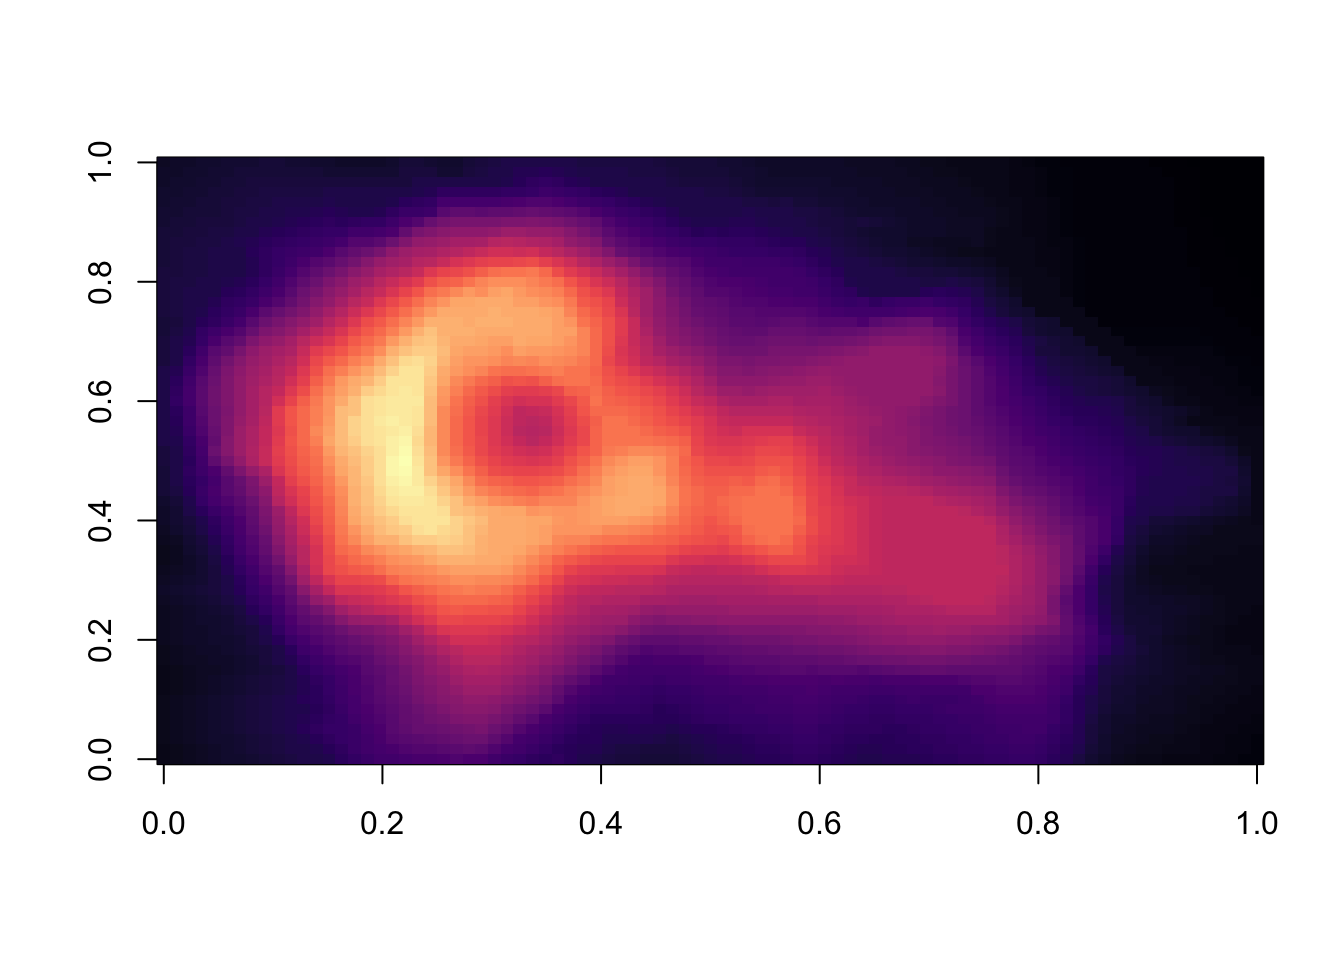
Magma colors
image(volcano, col = viridis(200, option = "A"))